

There is a well-worn line, usually attributed to Harry Markowitz, that diversification is “the only free lunch in investing.” It gets repeated so often that it has stopped meaning anything. So let me try to make it mean something again, with numbers, pictures, and one honest warning.
The claim is narrow and precise: if you average several strategies that are genuinely uncorrelated, you keep the return and throw away much of the risk. Not all diversification is free. This particular kind almost is.
The setup
Imagine you have N trading strategies. To keep the algebra clean, assume each one has:
the same expected return, μ,
the same volatility, σ,
and an average pairwise correlation ρ between any two of them.
You allocate equally — 1/N to each — and hold the blend. What happens to your risk-adjusted return?
The expected return of the average is the average of the expected returns. They are all μ, so the blend also returns μ. Averaging does nothing to your edge. That is the first key fact and it surprises people: you are not watering down the return.
The volatility is where the magic is. The variance of an equal-weight average of N correlated series works out to:

Divide the unchanged return by the shrunken volatility and the Sharpe ratio of the blend, relative to a single strategy, improves by exactly:

Everything interesting in this article is hiding in that one expression.
Reading the formula
Set ρ = 0 — perfectly uncorrelated strategies. The multiplier collapses to √N:

Two independent strategies give you √2 ≈ 1.41× the Sharpe. Four give you 2×. Nine give you 3×. It never plateaus. You could, in principle, manufacture an arbitrarily good risk-adjusted return out of arbitrarily mediocre independent pieces. That is the free lunch, stated bluntly.
Now set ρ to something realistic and positive. Take the limit as N grows and the multiplier converges to a hard ceiling of 1/√ρ:

At ρ = 0.4, no matter how many strategies you stack, you cannot get past about 1.58× a single strategy’s Sharpe. The hundredth correlated strategy is nearly worthless.
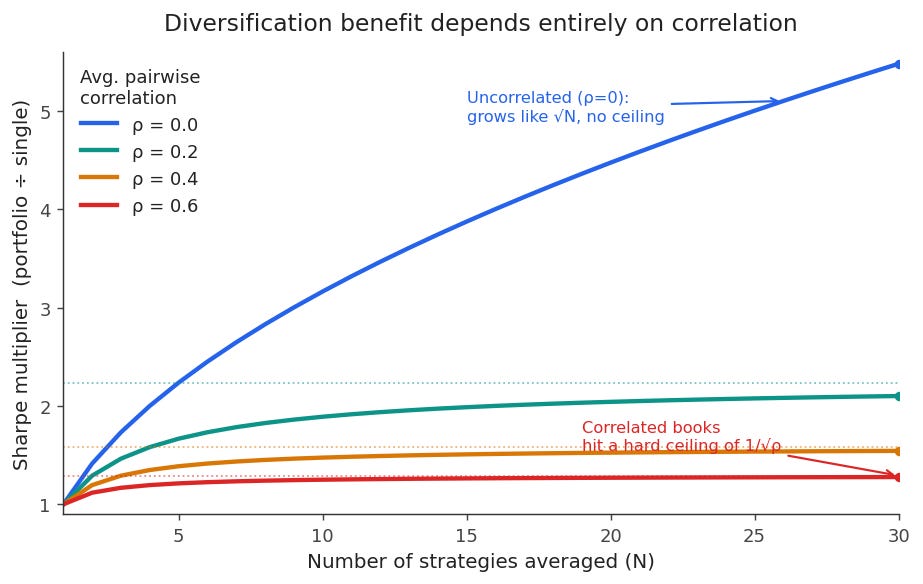
The chart makes the two regimes vivid. The blue curve (ρ = 0) climbs forever. Every other curve flattens fast against its 1/√ρ ceiling. Diversification is not a property of how many strategies you have. It is a property of how independent they are. Ten correlated books are one book with a costume.
Why it works, intuitively
Think of each strategy’s daily return as edge plus noise. The edge is the small, persistent thing you are actually harvesting. The noise is everything else — luck, microstructure, the market’s mood.
When you average independent strategies, the edges — being the same sign and roughly aligned — add up and survive. The noise terms, being independent, partially cancel: some are positive today, some negative, and they blur toward their mean of zero. You are running a signal-averaging operation, the same one an engineer uses to pull a faint tone out of static by recording it many times and stacking the takes.
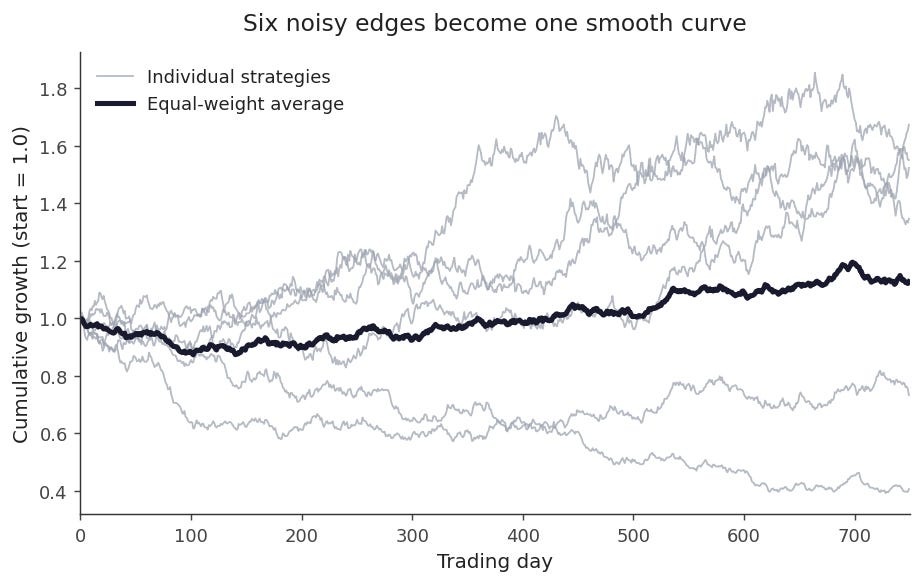
Above are six independent strategies, each with a small positive edge buried under a lot of daily noise. Individually they wander — any one of them could have a miserable year. Their equal-weight average (the dark line) is dramatically smoother while ending in the same neighborhood. Same destination, far less white-knuckling along the way.
Another way to see it: averaging shrinks the distribution of your returns around the edge without moving the edge itself.
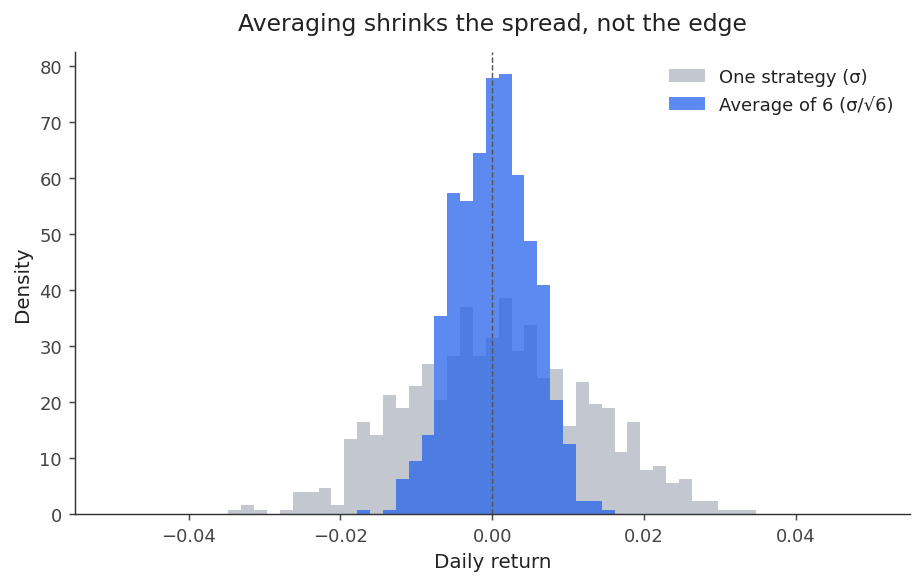
The grey histogram is one strategy’s daily returns — wide, with the edge nearly invisible inside the spread. The blue histogram is the six-strategy average: the same center of mass, but the spread has contracted by a factor of √6. The edge that was drowned out is now poking above the noise floor. This is just the Central Limit Theorem: the standard error of an average of N independent draws falls as

The assumption that ruins everything
Here is the part every honest version of this article has to include, because the dishonest versions are how people blow up.
“Uncorrelated” is doing all the work, and it is far more fragile than it looks.
First, correlation is not a fixed constant you get to assume. You estimate it from data, and correlation estimates are noisy, unstable, and — worst of all — regime-dependent. Two strategies can show 0.05 correlation across a calm sample and 0.9 correlation in the week everything sells off at once. Correlations have a cruel habit of racing toward 1 exactly when you are relying on them being near 0. The diversification evaporates in the drawdown you built it to survive.
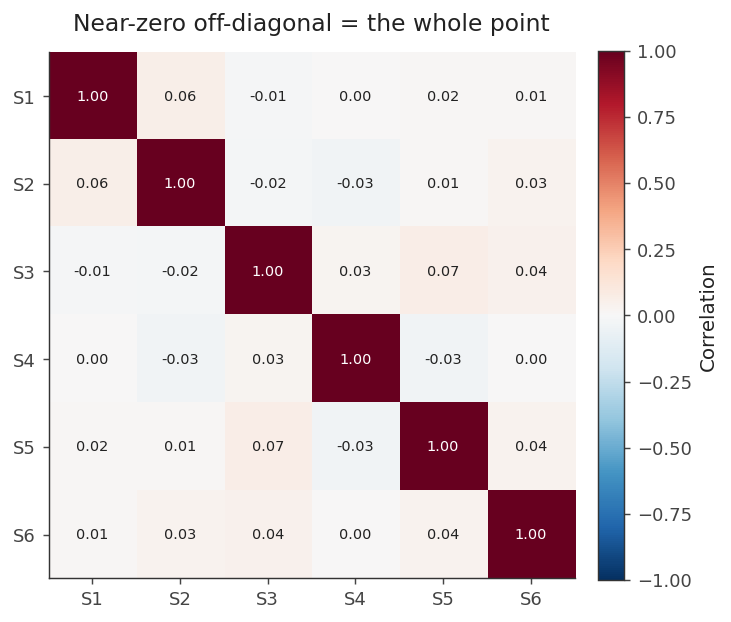
A heatmap like this — near-zero everywhere off the diagonal — is what you want to see. But this one is computed on the full, calm sample. The real question is what it looks like conditioned on the worst 5% of days. Always check the tail correlation, not just the average.
Second, independence in the code is not independence in the P&L. Two strategies that are mechanically different — one a momentum signal, one a mean-reversion signal — can still both be, underneath, a bet on liquidity, or volatility, or the same crowded factor. They look uncorrelated until the day the hidden common factor moves, and then they are the same trade.
Third, more strategies means more parameters, more fitting, more chances to fool yourself. Adding a genuinely new independent edge is gold. Adding your ninth variation of the same edge, lightly reparameterized, adds risk and cost while doing almost nothing for you — that flat part of the correlated curves is where most over-engineered “diversified” systems actually live.
What the payoff looks like when it’s real
To close the loop, here is a Monte Carlo experiment. I simulate the realised two-year Sharpe you’d actually observe — not the theoretical one — for three cases: a single strategy, ten strategies with ρ = 0.3, and ten strategies that are truly independent.
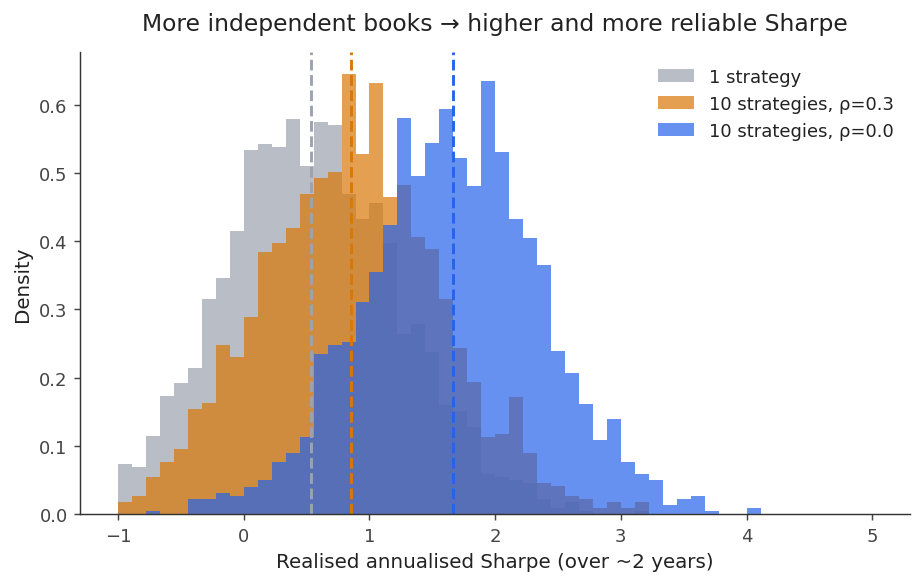
Two things happen as you move from grey to amber to blue. The distribution shifts right — higher average Sharpe — and it gets narrower — more reliable, less dependent on luck. That second effect is underrated. Independent averaging doesn’t just raise your expected outcome; it shrinks the range of outcomes, which is what actually lets you keep the position on through a bad stretch instead of capitulating at the bottom.
Notice, too, that the correlated-ten (amber) sits much closer to the single strategy (grey) than to the independent-ten (blue). The correlation tax is brutal and the picture shows it.
Practical rules that fall out of this
Hunt for independence, not perfection. Three uncorrelated 0.5-Sharpe strategies beat one heavily-optimized 1.0-Sharpe strategy — and are far less likely to be overfit.
Equal weighting is a strong default. Optimizers want to exploit the correlation matrix, but that matrix is the thing you can least reliably estimate. Fancy weighting schemes usually overfit the noise in ρ. Start equal-weight; deviate only with a real reason.
Stress the correlation in the tails. Compute it conditional on your worst days, not just on the full sample. If it spikes, your diversification is a fair-weather friend.
Watch for hidden common factors. Ask what each strategy is really betting on. If several share an unspoken exposure — the same factor, the same liquidity assumption — treat them as one.
Diminishing returns are real. Past a handful of genuinely independent books, each addition helps less. Spend your effort finding a different edge, not a variation on one you already have.
The takeaway
Averaging uncorrelated strategies is as close to a free lunch as markets offer, and the math is not subtle: √N improvement when correlations are zero, a hard 1/√ρ ceiling the moment they aren’t. The whole game reduces to one quantity — ρ — and to the uncomfortable fact that ρ is unstable, hard to estimate, and prone to betraying you in exactly the conditions you were insuring against.
So by all means take the free lunch. Just read the fine print on the menu first.
If you found this useful, the accompanying figures were generated from simple simulations — the equations in the piece are all you need to reproduce them. Subscribe for more pieces that take one idea and push it until it either breaks or becomes useful.